
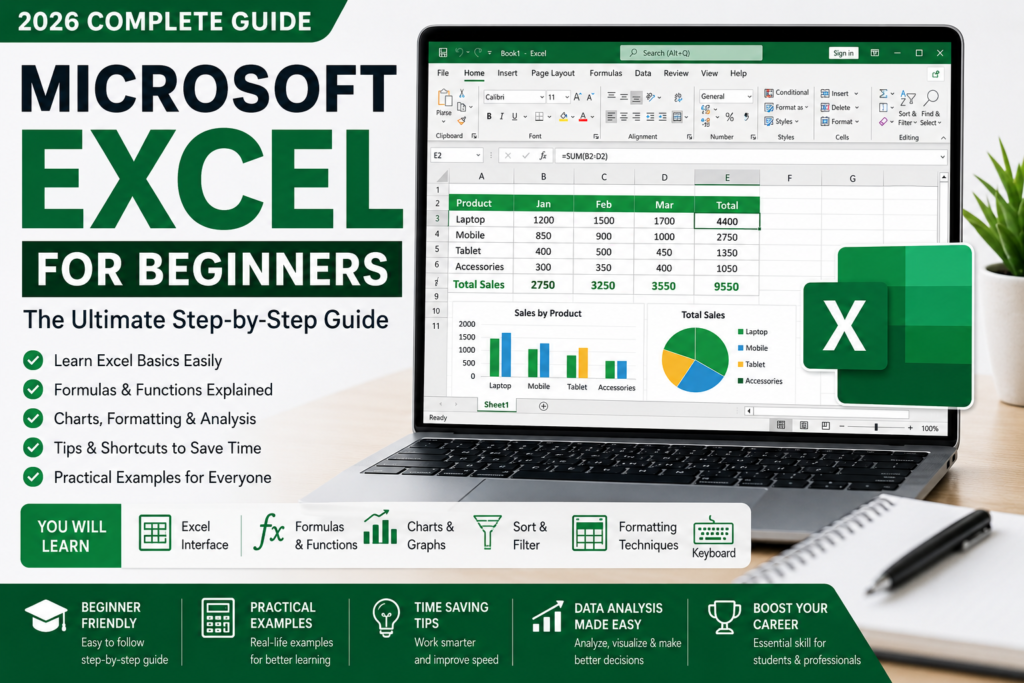
Microsoft Excel for Beginners: The Ultimate Step-by-Step Guide (2026)
Microsoft Excel is one of the most powerful spreadsheet applications in the world. Whether you’re a student organizing assignments, a business owner managing finances, an accountant analyzing data, or an office professional creating reports, Excel provides the tools needed to work with numbers efficiently.
From simple calculations to advanced data analysis, Microsoft Excel helps users organize information, automate repetitive tasks, create charts, and make informed decisions. Learning Excel is one of the most valuable digital skills you can develop because it is widely used across industries, including finance, education, healthcare, engineering, marketing, and project management.
This beginner-friendly guide will introduce you to Microsoft Excel, explain its interface, teach you how to create your first spreadsheet, use formulas, format data, and build professional worksheets with confidence.
Table of Contents
- What is Microsoft Excel?
- Why Learn Excel?
- Understanding the Excel Interface
- Creating Your First Workbook
- Rows, Columns, and Cells
- Entering and Editing Data
- Formatting Cells
- Basic Formulas
- Essential Functions
- Charts
- Sorting and Filtering Data
- Conditional Formatting
- Keyboard Shortcuts
- Beginner Tips
- FAQs
- Conclusion
What is Microsoft Excel?
Microsoft Excel is a spreadsheet application developed by Microsoft as part of Microsoft Office and Microsoft 365. It allows users to organize, calculate, analyze, and visualize data using rows, columns, formulas, and charts.
Excel is commonly used for:
- Budget planning
- Expense tracking
- Attendance sheets
- Sales reports
- Financial analysis
- Data management
- Inventory tracking
- Project planning
- Student gradebooks
- Business dashboards
Because of its flexibility, Excel is considered one of the most important software applications in today’s workplace.
Why Learn Microsoft Excel?
Excel is a valuable skill that can improve both personal productivity and career opportunities.
Benefits include:
- Organize data efficiently
- Perform automatic calculations
- Save time using formulas
- Create professional charts
- Analyze business data
- Improve decision-making
- Increase job opportunities
- Automate repetitive tasks
Many employers list Microsoft Excel as a required skill, making it an excellent investment in your professional development.
Understanding the Excel Interface
When you open Microsoft Excel, you’ll see several important sections.
Title Bar
Displays the name of the workbook.
Ribbon
Contains all Excel tools organized into tabs such as:
- Home
- Insert
- Page Layout
- Formulas
- Data
- Review
- View
Formula Bar
Shows the contents or formula of the selected cell.
Worksheet
The main area where you enter and manage data.
Sheet Tabs
Allow you to create multiple worksheets within one workbook.
Status Bar
Displays information such as average, count, and sum of selected cells.
Creating Your First Workbook
Creating a workbook is simple.
- Open Microsoft Excel.
- Click Blank Workbook.
- Begin entering your data into cells.
- Save your workbook using Ctrl + S.
Excel automatically organizes information into rows and columns.
Understanding Rows, Columns, and Cells
A worksheet is made up of:
- Rows: Horizontal lines numbered 1, 2, 3, and so on.
- Columns: Vertical lines labeled A, B, C, D, and beyond.
- Cells: The intersection of a row and column, such as A1, B5, or C10.
Each cell can contain text, numbers, dates, formulas, or functions.
Entering and Editing Data
Click on any cell and begin typing.
You can enter:
- Text
- Numbers
- Dates
- Currency
- Percentages
- Formulas
To edit a cell, double-click it or press F2.
Formatting Your Spreadsheet
Formatting improves readability and professionalism.
You can customize:
- Font style
- Font size
- Bold, Italic, Underline
- Cell colors
- Borders
- Number formats
- Alignment
- Currency
- Percentages
A well-formatted spreadsheet is easier to understand and analyze.
Basic Excel Formulas
Formulas always begin with an equals sign (=).
Examples:
Addition
=A1+B1
Subtraction
=A1-B1
Multiplication
=A1*B1
Division
=A1/B1
Excel calculates results instantly whenever data changes.
Essential Excel Functions
Functions simplify complex calculations.
SUM
Adds numbers.
Example:
=SUM(A1:A10)
AVERAGE
Calculates the average value.
=AVERAGE(B1:B20)
MAX
Finds the highest number.
=MAX(C1:C50)
MIN
Finds the smallest number.
=MIN(C1:C50)
COUNT
Counts cells containing numbers.
=COUNT(D1:D100)
These five functions are among the most frequently used in Excel.
Creating Charts
Charts make data easier to understand.
Popular chart types include:
- Column Chart
- Bar Chart
- Pie Chart
- Line Chart
- Area Chart
To insert a chart:
- Select your data.
- Click Insert.
- Choose a chart type.
Charts are useful for presentations, reports, and business analysis.
Sorting Data
Sorting helps organize information.
Examples:
- Alphabetically
- Lowest to highest
- Highest to lowest
- Oldest to newest
- Newest to oldest
This feature is especially useful for large datasets.
Filtering Data
Filtering allows you to display only the information you need.
Examples:
- Show only specific departments
- Display certain dates
- Filter products by category
- Find top-performing sales
Filters make analyzing large spreadsheets much easier.
Conditional Formatting
Conditional Formatting automatically highlights cells based on rules.
Examples include:
- High values in green
- Low values in red
- Duplicate entries
- Data bars
- Color scales
This helps identify trends and important information at a glance.
Essential Keyboard Shortcuts
| Shortcut | Function |
|---|---|
| Ctrl + N | New Workbook |
| Ctrl + O | Open Workbook |
| Ctrl + S | Save Workbook |
| Ctrl + P | |
| Ctrl + C | Copy |
| Ctrl + V | Paste |
| Ctrl + X | Cut |
| Ctrl + Z | Undo |
| Ctrl + Y | Redo |
| Ctrl + F | Find |
| Ctrl + H | Replace |
| Ctrl + Arrow Keys | Jump to Data Edge |
| F2 | Edit Selected Cell |
| Alt + = | AutoSum |
Learning these shortcuts can greatly improve your speed and efficiency.
Beginner Tips
If you’re new to Microsoft Excel, keep these tips in mind:
- Save your work frequently.
- Keep your data organized.
- Use clear column headings.
- Learn basic formulas before advanced functions.
- Practice keyboard shortcuts.
- Use tables to organize information.
- Format numbers correctly.
- Create charts to visualize data.
- Double-check formulas for accuracy.
- Back up important work using OneDrive.
Common Uses of Microsoft Excel
Excel is widely used for:
- Personal budgeting
- Expense tracking
- Payroll management
- Business reporting
- Inventory management
- Student records
- Financial forecasting
- Data analysis
- Project planning
- Sales reporting
Its versatility makes it useful in almost every profession.
Frequently Asked Questions
Is Microsoft Excel difficult to learn?
No. Beginners can quickly learn the basics with regular practice, and more advanced features can be explored over time.
What is the difference between a workbook and a worksheet?
A workbook is the Excel file, while a worksheet is an individual spreadsheet within that file.
Which Excel function should beginners learn first?
The SUM function is one of the most important and easiest functions to learn.
Can Excel create charts automatically?
Yes. Excel provides built-in chart tools that generate professional visualizations from selected data.
Is Microsoft Excel useful for students?
Absolutely. Students can use Excel for calculations, assignments, research, project planning, and organizing data.
Conclusion
Microsoft Excel is much more than a spreadsheet application—it’s a powerful productivity tool that helps users organize data, perform calculations, analyze information, and create professional reports. By understanding the Excel interface, learning basic formulas, using essential functions, and practicing with real-world examples, beginners can quickly develop valuable skills that apply in both academic and professional settings.
Whether you’re tracking expenses, managing business data, creating charts, or analyzing information, Excel provides the flexibility and efficiency needed to work smarter. Continue exploring Microsoft Excel tutorials on Zenorow.com to learn advanced formulas, PivotTables, dashboards, automation techniques, and other features that will help you become a confident Excel user.
Leave a Reply